


What is Science? Science is a system or method reconciling practical ends with scientific laws.
What is Data Science?
Data science is the understanding of the world through the scientific analysis of digital data.
Data Science combines the scientific method, math and statistics, specialized programming, advanced analytics, artificial intelligence (AI), and even storytelling to uncover and explain the business insights buried in data. Data science is a multidisciplinary approach to extracting actionable insights from the large and ever-increasing volumes of data collected and created by today’s businesses.

People who work in data science prepare data for analysis and processing, perform advanced data analysis, and present the results to reveal patterns and enable stakeholders to draw informed conclusions. People who work in data science also use technologies and tools to build models to predict outcomes, discover underlying patterns, and gain insights that can lead to actions that improve future outcomes. Data is a commodity. Businesses need ways to process data to find its value. Data science is a repeatable, scientific process. That’s not to say data science is mechanical and void of creativity. But data processing — from collecting data sources and data cleansing to machine learning and eventually visualization includes unique steps that are involved in transforming raw data into insight.
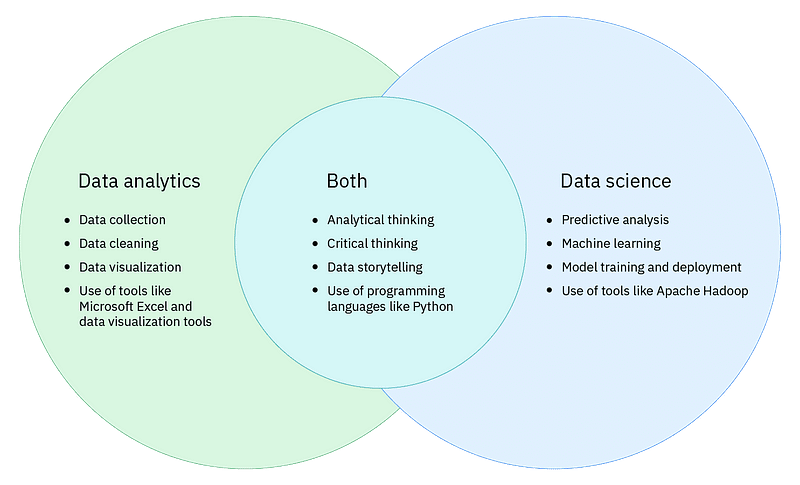
Data analytics and data science are two terms that are often used in the same context. But, it’s important to know they have different definitions. Both fields work with data, and they share the same goal: to translate data analysis into business intelligence. The main difference between data analytics and data science is in what data analysts and data scientists do with data, meaning the tactics used. Here is how they are differentiated:
Data Analysts collect and examine large data sets to identify trends, forecasts, and data visualizations to tell a compelling story through actionable insights. These insights help businesses make informed decisions about business needs.
Data Scientists design and create new processes for data modeling. They use algorithms, predictive analytics, and statistical analysis. Data scientists have the technical skills to arrange unstructured data and build their methodologies to make predictions based on data trends.
Stages for Data Science Project:-
Data Acquisition:- The lifecycle begins with the data collection of both raw structured and unstructured data from all relevant sources using a variety of methods. These methods can include manual entry, web scraping, and real-time streaming data from systems and devices. Data sources can include structured data, such as customer data, along with unstructured data such as log files, video, audio, pictures, IOT, social media, and more.
Data Storage and Data Processing:- Since data can have different formats and structures, companies need to consider different storage systems based on the type of data that needs to be captured. Data management teams help to set standards around data storage and structure, which facilitate workflows around analytics, machine learning, and deep learning models. This stage includes cleaning data, deduplicating, transforming, and combining the data using ETL (extract, transform, load) jobs or other data integration technologies. This data preparation is essential for promoting data quality before loading into a Data Warehouse, Data Lake, or other repository.
Data Analysis:- Here, data scientists conduct an exploratory data analysis to examine biases, patterns, ranges, and distributions of values within the data. This data analytics exploration drives hypothesis generation for a/b testing. It also allows analysts to determine the data’s relevance for use within modeling efforts for predictive analytics, machine learning, and/or deep learning. Depending on a model’s accuracy, organizations can become reliant on these insights for business decision-making, allowing them to drive more scalability.
Communicate:- Finally, insights are presented as reports and other data visualizations that make the insights and their impact on business easier for business analysts and other decision-makers to understand. A data science programming language such as R or Python includes components for generating visualizations; alternately, data scientists can use dedicated visualization tools.
Thank your readers for joining you on the journey through the world of data science and encourage them to stay tuned for more valuable insights.