Unveiling Microbusiness Dynamics - A Data-Driven Approach to Forecasting and Analysis
In the rapidly evolving landscape of small businesses, microbusinesses are vital drivers of innovation, job creation, and economic growth. These small-scale enterprises often serve as the backbone of local economies, providing opportunities in regions where larger companies may not reach. However, understanding the trends and dynamics of microbusinesses such as where they are thriving, how fast they are growing, and what factors influence their sustainability is a challenging task.
Our project titled “Unveiling Microbusiness Dynamics" aimed to address this challenge using a data-driven approach. By leveraging historical data and advanced machine learning techniques, we developed predictive models to forecast the density of microbusinesses across different regions. Through this project, we explored how regional patterns in microbusiness growth could be used to provide valuable insights for entrepreneurs, policymakers, and economic development agencies.
PermalinkProject Objective
The primary objective of our project, “Unveiling Microbusiness Dynamics” was to develop a predictive model that could accurately forecast the growth and density of microbusinesses across various regions. We aimed to understand the key drivers behind the rise of these small scale enterprises and predict how they would evolve in the future based on historical data.
Microbusinesses are typically defined as businesses with fewer than 10 employees, playing a crucial role in local economies by generating jobs and fostering innovation. Despite their importance, the lack of comprehensive and timely data on micro business dynamics poses challenges to understanding how these businesses perform, especially in different geographic locations. Therefore, our goal was to shed light on the following questions:
Predicting Microbusiness Growth:- We sought to build a predictive model that could forecast the microbusiness density (number of microbusinesses per population) in the future. Our model aimed to generate forecasts for upcoming months by analyzing patterns from past data. Accurate predictions would provide valuable insights to support business planning, policy making, and resource allocation.
Identifying Regional Patterns:- One of the key objectives was to analyze how micro businesses were distributed across different regions and identify any underlying patterns. By understanding which areas were experiencing rapid growth and which were lagging, we could help inform regional development strategies and provide targeted support to underperforming areas.
Understanding Economic Indicators:- We aimed to explore how various socio-economic factors influence the growth of microbusinesses. These factors could include variables like unemployment rates, income levels, population density, access to financial resources, and technological adoption. By analyzing these indicators, we sought to highlight the main drivers behind microbusiness success or stagnation in different regions.
Building a Scalable Forecasting Framework:- We aimed to develop a machine learning framework that could be easily scaled and adapted to different datasets. Our goal was to ensure that the model could be applied to other regions or business sectors, enabling a wide range of applications beyond just micro businesses.
Delivering Insights for Policy and Decision Makers:- Ultimately, the objective of our project was to generate actionable insights for entrepreneurs, policymakers, and economic development agencies. By predicting trends in micro business growth, decision-makers could plan better interventions, allocate resources more efficiently, and craft policies that promote sustainable development in the regions most in need.
PermalinkSignificance of the Project
Our project aimed to provide an evidence based approach to understanding and supporting microbusinesses, whose success is crucial to fostering local economies and creating jobs. By offering tools that accurately predict future trends, our project could be instrumental in shaping informed strategies for business owners and local governments, contributing to a healthier entrepreneurial ecosystem.

PermalinkData Overview for UMD
In our project, we utilized data that provided historical insights into the microbusiness density across various counties in the United States. This dataset was crucial for analyzing trends and predicting future changes in local business activities. Here’s a detailed breakdown of the dataset:
County FIPS (cfips):- Each U.S. county is assigned a unique Federal Information Processing Standard (FIPS) code, known as cfips. This code allows us to distinguish data between different counties. By leveraging this code, we could segment and analyze microbusiness density at a granular level.
Microbusiness Density:- This variable represents the number of micro-businesses per capita within a given region. Microbusinesses are typically very small enterprises, often run by a sole proprietor or a small team. Tracking this metric over time provides insight into entrepreneurial activity and local economic development across different regions.
Date:- The dataset included time-series entries, with each record linked to a specific date, covering multiple years. This temporal data allowed us to observe changes in microbusiness density over time and identify trends or shifts that might reflect broader economic changes or responses to events like the COVID-19 pandemic.
PermalinkData Source
The dataset was obtained from public economic and business records. It is likely sourced from platforms such as GoDaddy which hosts open datasets related to local business activities and U.S. demographics. These datasets are derived from a range of governmental and commercial sources, including the U.S. Census Bureau and local business registries.
PermalinkData Size
The dataset contained thousands of rows, each representing a specific county at a given time, which made it substantial in size. Each row had a unique combination of a county’s FIPS code, the date, and the corresponding microbusiness density. Handling this volume of data required the use of big data frameworks to ensure efficient processing and analysis. We used Apache Spark to process the data, as its ability to handle large datasets in a distributed manner allowed for quicker computations and easier data manipulation.
PermalinkKey Steps in the Project
Permalink1. Data Preprocessing
Before diving into model training, the first step was preparing the dataset. This involved:
Handling Missing Data: Ensuring all missing values were handled correctly to avoid model bias.
Feature Engineering: Creating lag features (lag-1, lag-2, etc.), which represented the microbusiness density from previous months. These features were crucial in identifying time-based patterns.
df['lag_1'] = df['microbusiness_density'].shift(1)
df['lag_2'] = df['microbusiness_density'].shift(2)
Permalink2. Model Selection: XGBoost
We chose XGBoost (Extreme Gradient Boosting) as our model due to its high performance on structured datasets. XGBoost is an ensemble learning method that builds multiple weak models (decision trees) and combines them to form a stronger model. Its ability to handle both linear and non-linear relationships made it ideal for our time-series data.
import xgboost as xgb
model = xgb.XGBRegressor(objective='reg:squarederror')
model.fit(X_train, y_train)
Permalink3. Cross-Validation
To ensure our model was robust and generalized well to unseen data, we implemented cross validation with multiple folds. Cross-validation allowed us to train and test our model on different subsets of the data, helping to prevent overfitting.
from sklearn.model_selection import TimeSeriesSplit
tscv = TimeSeriesSplit(n_splits=5)
for train_index, test_index in tscv.split(X):
We specifically used a time-series split method to ensure that the model only used past data to predict future values (since microbusiness densities evolve over time).
PermalinkResults & Performance Evaluation
Permalink1. Model Performance
The primary metric we used to evaluate our model was SMAPE (Symmetric Mean Absolute Percentage Error). SMAPE is a widely-used error metric in time-series forecasting, as it accounts for both under and over-predictions symmetrically.
Across different cross-validation folds, our model achieved a SMAPE score between 3.19% and 3.41%. These scores indicate the percentage error in our predictions and show that our model was quite accurate in forecasting future microbusiness densities.
SMAPE = 100 * (|Actual - Predicted|) / ((|Actual| + |Predicted|) / 2)
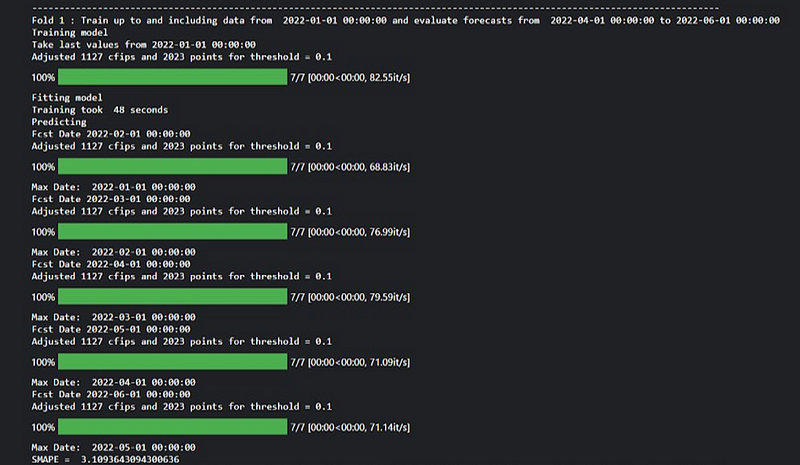
1. Fold-wise Training and Evaluation:- The model is trained with historical data up to a specific date and evaluated for subsequent periods in each fold of cross validation.
2. Training Process:- The model is fitted to the training data, with adjustments made to parameters and data processing to enhance accuracy.
3. Forecasting:- Forecasts are generated for future periods, starting from the month following the last training date and continuing for several months.
4. Evaluation Metrics:- Evaluation metrics like SMAPE measure the accuracy of forecasts compared to actual values, providing insight into model performance.
5. Cross-Validation Folds:- The process repeats for multiple folds, each representing distinct training and evaluation periods, with details provided for each fold’s training, forecasting, and evaluation.
The output showcases the training, evaluation, and forecasting process of the model. It demonstrates how the model is trained on historical data and evaluated for its predictive accuracy in future periods. The forecasts generated are compared to actual values, and evaluation metrics like SMAPE provide insights into forecast accuracy. Multiple cross validation folds offer a comprehensive assessment of the model’s performance across different datasets. Overall, the output helps understand the model’s ability to make reliable predictions and provides feedback for model refinement.
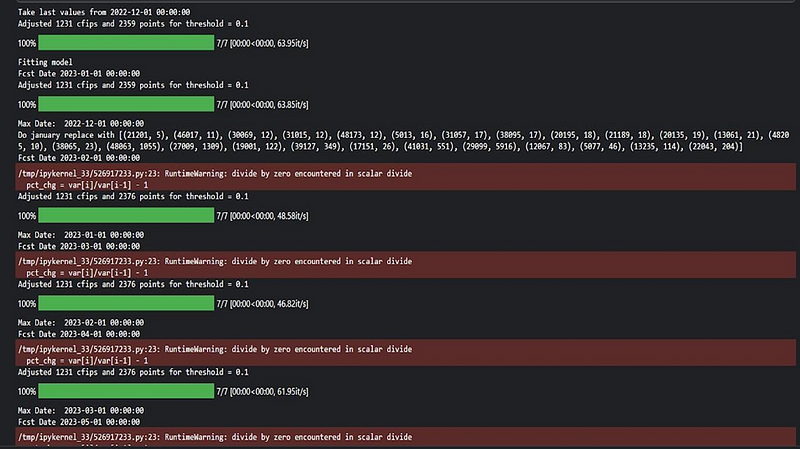
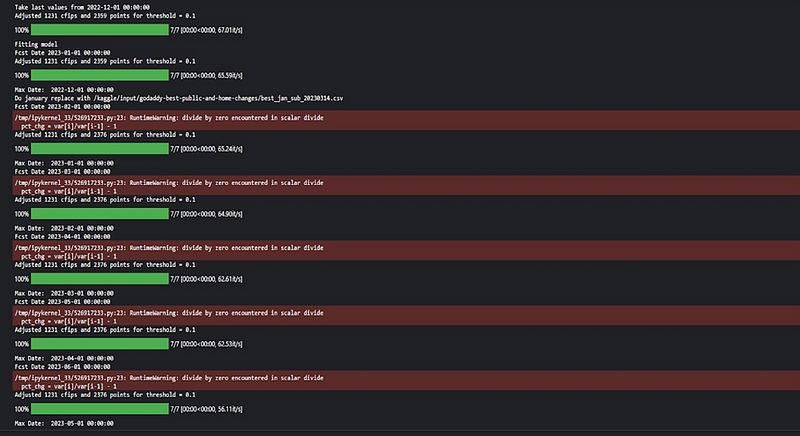
1. Forecast for 2023–01–01: Adjusted 1231 cfips and 2359 points for threshold = 0.1.
2. Forecast for 2023–02–01: Adjusted 1231 cfips and 2376 points for threshold = 0.1.
3. Forecast for 2023–03–01: Adjusted 1231 cfips and 2376 points for threshold = 0.1.
4. Forecast for 2023–04–01: Adjusted 1231 cfips and 2376 points for threshold = 0.1.
5. Forecast for 2023–05–01: Adjusted 1231 cfips and 2376 points for threshold = 0.1.
6. Forecast for 2023–06–01: Adjusted 1231 cfips and 2376 points for threshold = 0.1.
Permalink2. Visualizing Results & Analysis
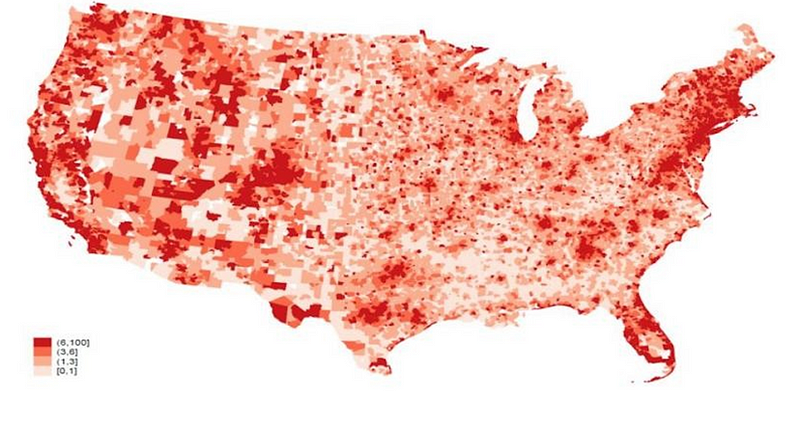
To make the results more intuitive, we visualized the predicted vs actual densities over time for several counties. This helped in identifying trends, such as counties where microbusiness growth was accelerating or slowing down.
Ventures by Zip Code
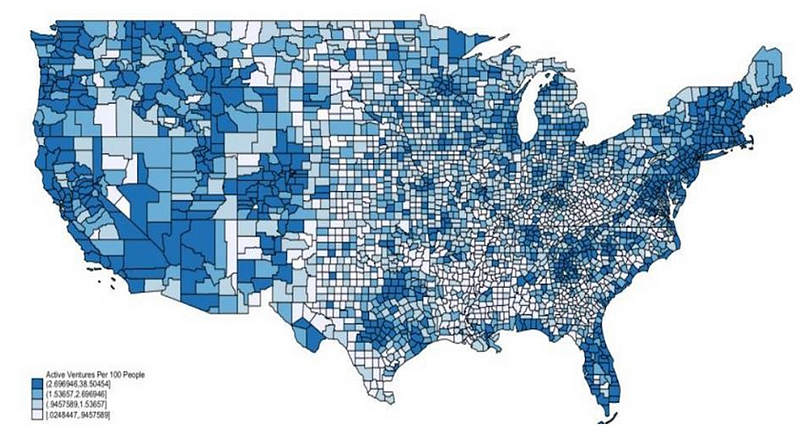
Ventures by County
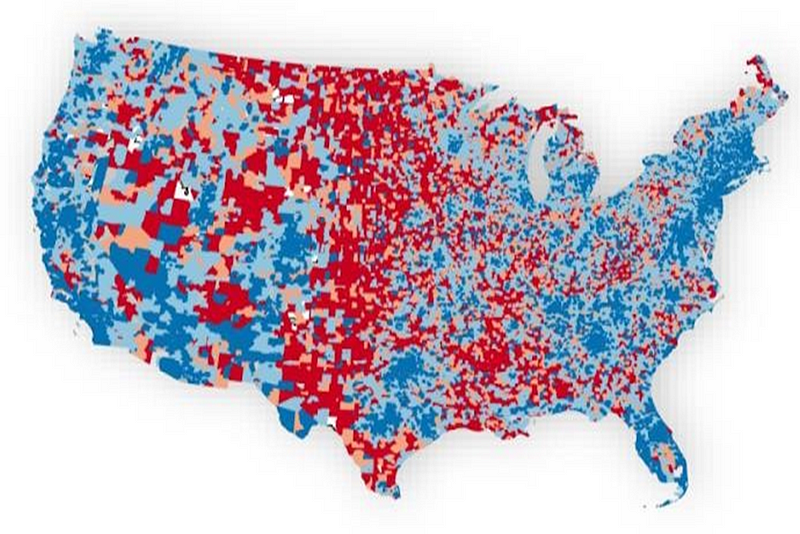
The ratio of Ventures to Small Businesses (more ventures in blue)
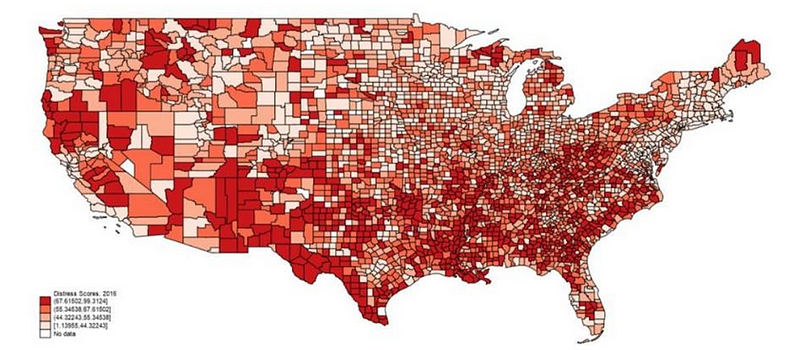
Distressed Communities Index by County
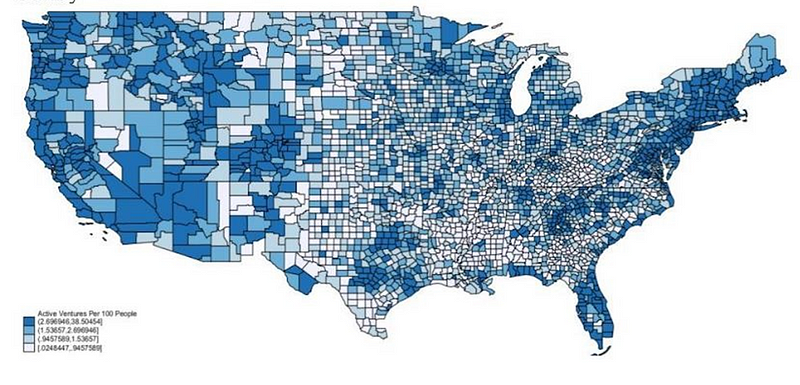
Density of Ventures (Domain Name Websites and their Redirects) per 100 people, by County

Density of Venture by Activity Level/Clusters and County, Nov 2018
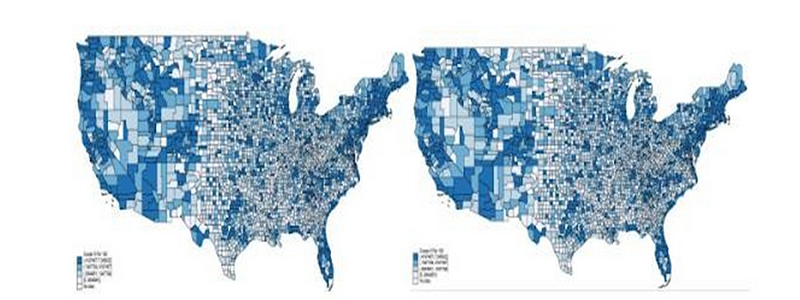
Density of Venture by Activity Level/Clusters and Zip Code, Nov 2018
PermalinkSubmission
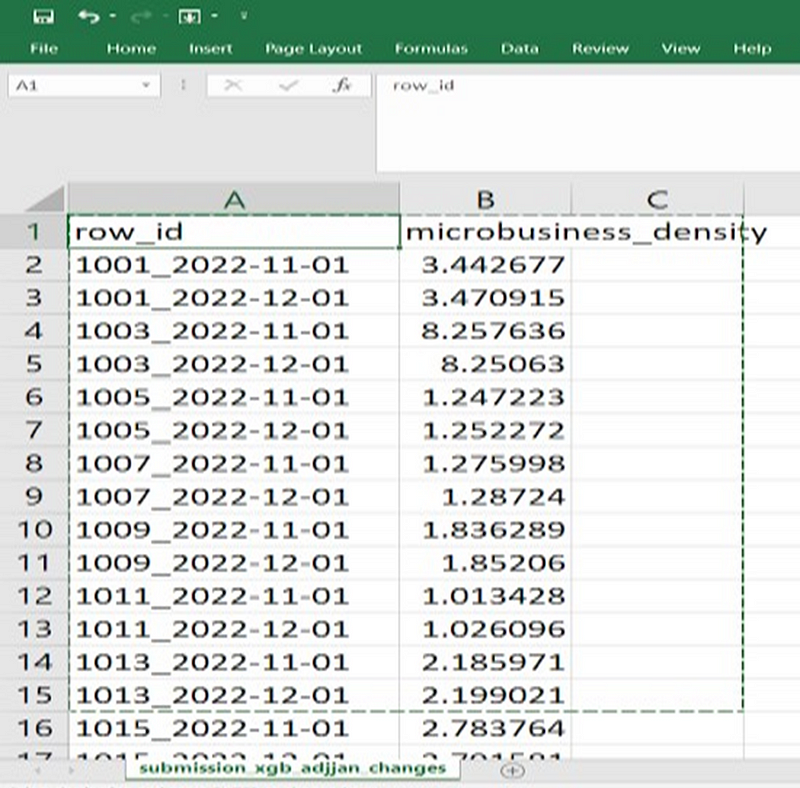
It contains microbusiness density predictions for different regions at two different time points, November 2022 and December 2022. Each row in the CSV file corresponds to a specific region (identified by row_id) and its predicted microbusiness density for either November 2022 or December 2022.
· For region 1001, the predicted microbusiness density is 3.442677 for November 2022 and 3.4709148 for December 2022.
· For region 1003, the predicted microbusiness density is 8.2576361 for November 2022 and 8.2506304 for December 2022.
· For region 1005, the predicted microbusiness density is 1.2472228 for November 2022 and 1.2522722 for December 2022.
· For region 1007, the predicted microbusiness density is 1.2759978 for November 2022 and 1.28724 for December 2022.
· For region 1009, the predicted microbusiness density is 1.8362887 for November 2022 and 1.8520604 for December 2022.
· For region 1011, the predicted microbusiness density is 1.013428 for November 2022 and 1.0260957 for December 2022.
· For region 1013, the predicted microbusiness density is 2.1859705 for November 2022 and 2.1990211 for December 2022.
These predictions provide insights into the expected density of microbusinesses in various regions for the specified time points.
PermalinkChallenges Faced
While the project was successful, we encountered several challenges along the way:-
Handling Missing Data:- Several counties had incomplete data for certain months. We had to decide whether to impute missing values or exclude those counties.
Seasonality and Trends:- Identifying and incorporating seasonal patterns in microbusiness growth required careful feature engineering.
Computational Resources:- Training on a large dataset with a gradient boosting model like XGBoost required significant computational power.
PermalinkConclusion
Our project “Unveiling Microbusiness Dynamics” provided valuable insights into the growth and density of microbusinesses across various regions. By applying machine learning and time-series forecasting techniques, we were able to predict future densities with high accuracy. This kind of analysis can help decision-makers at various levels better understand the factors influencing microbusiness growth and plan accordingly.
PermalinkAcknowledgments
We want to extend a big thank you to our mentors, friends, and teammates for their support throughout the project.
Special thanks to:-
Sachin Bade
